San Diego County Housing Summary
What’s Your Home Worth?
https://sdsellers.com/
San Diego Housing Market: Myth vs. Reality (May 29, 2025)
Don’t fall for the headlines—here’s what’s really happening.
In today’s market, negative social media narratives often drown out the facts. Let’s bust some common myths:
MYTH: The market is flooded with homes.
REALITY: Inventory has grown—but it’s still far below pre-2019 or Great Recession levels. Low supply continues to support pricing stability.
MYTH: Prices are about to crash.
REALITY: Pricing may flatten or dip slightly, but thanks to strong homeowner equity, low foreclosure risk, and qualified buyers, a crash isn’t coming.
MYTH: No one is selling due to low mortgage rates.
REALITY: More sellers are listing now than in the past two years, despite higher rates. San Diego saw 49% more homes for sale than in 2023.
MYTH: Waiting will get you a better deal.
REALITY: Timing the market rarely works. When rates dip, demand spikes—and bidding wars return. Buying now can give you leverage with motivated sellers. Just Listed Homes
Important Buyer Note:
If you don’t plan to own your home for at least 3 years, now may not be the right time to buy. With prices flattening and inventory rising, short-term ownership may not offer much upside. Data from Steven Thomas, Reports on Housing.
Want the facts on your neighborhood? View blog
No pressure—just real answers.
George Lorimer
Your Home Sold Guaranteed or I'll Buy It!*
*Conditions apply, ProWest Properties, DRE# 01146839
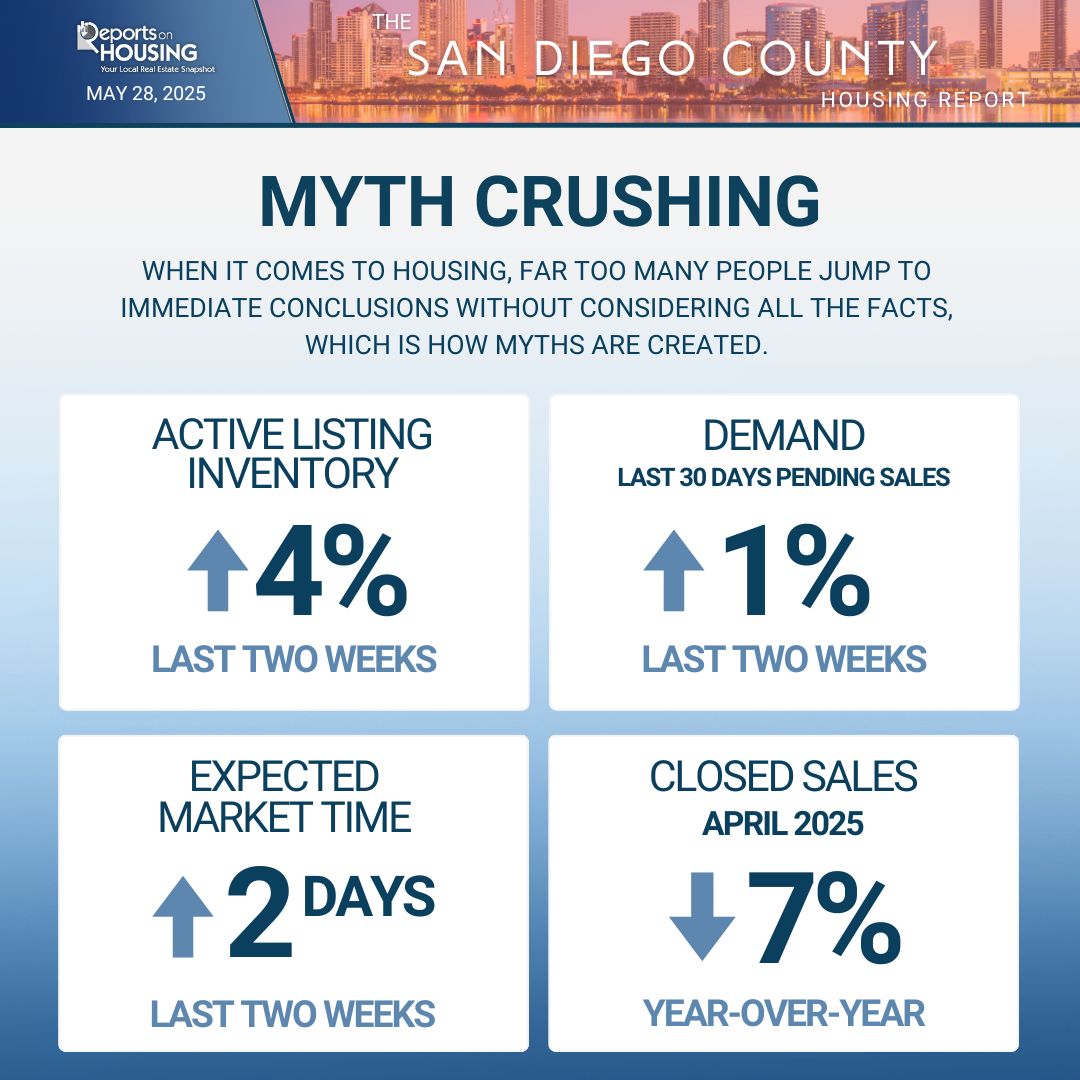
- INVENTORY: The active listing inventory in the past couple of weeks increased by 203 homes, up 4%, and now sits at 5,868, its highest level since November 2019. Last year, there were 3,672 homes on the market, 2,196 fewer homes, or 37% less. The 3-year average before COVID (2017-2019) was 6,424, which is 9% higher. From January through April, 23% fewer homes came on the market compared to the 3-year average before COVID (2017-2019), 4,175 less. Yet, 2,482 more sellers came on the market this year than last, and 4,556 more compared to 2023.
- DEMAND: Buyer demand, the number of pending sales over the prior month, increased from 1,874 to 1,884, up 10 pending sales, or 1%. Last year, there were 1,933 pending sales, 3% more. The 3-year average before COVID (2017-2019) was 3,564, which is 89% higher.
- MARKET TIME: With supply rising slightly faster than demand, the Expected Market Time, the number of days to sell all San Diego County listings at the current buying pace, increased from 91 to 93 days in the past couple of weeks. Last year, it was 57 days, substantially faster than today. The 3-year average before COVID (2017-2019) was 55 days, which is also significantly faster than today.

- LUXURY: In the past two weeks, the Expected Market Time for homes priced between $2 million and $4 million decreased from 135 to 133 days. For homes priced between $4 million and $6 million, the Expected Market Time increased from 260 to 308 days. For homes priced above $6 million, the Expected Market Time increased from 583 to 633 days.
- DISTRESSED HOMES: Short sales and foreclosures combined, comprised only 0.5% of all listings and 0.5% of demand. Only nine foreclosures and 19 short sales are available today in San Diego County, with a total of 28 distressed homes on the active market, up one from two weeks ago. Last year, 16 distressed homes were on the market, similar to today.
- CLOSED SALES: There were 2,248 closed residential resales in April, up 7% compared to April 2024’s 2,095 and up 21% from March 2025. The sales-to-list price ratio was 99.1% for San Diego County. Foreclosures accounted for 0.3% of all closed sales, and short sales accounted for 0.1% of all closed sales. That means that 99.6% of all sales were sellers with equity.
Copyright 2025—Steven Thomas, Reports On Housing—All Rights Reserved. This report may not be reproduced in whole or in part without express written permission from the author.

